 Statistical techniques are necessary in research and analysis to extract meaningful insights from data. They provide researchers with a structured framework for data interpretation and analysis, enabling them to identify their datasets’ linkages, patterns, and trends.
Basic statistical procedures are essential for novice and expert researchers as the foundation for more intricate analyses. This blog will examine statistical methods like probability theory, regression analysis, correlation, and descriptive and inferential statistics.

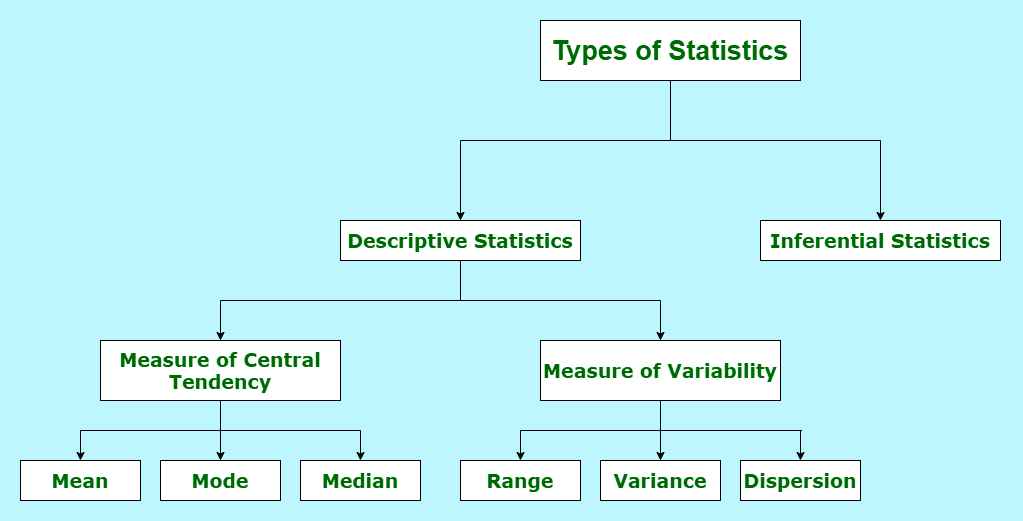
Descriptive Statistics
A dataset’s key characteristics can be summed up and described using descriptive statistics. They offer perceptions of the traits and trends found in the data.
The mean, median, and mode are examples of measures of central tendency that provide a center value around which the data cluster. Dispersion measures like range, variance, and standard deviation show the spread or variety of the data points.
Inferential Statistics
With inferential statistics, researchers can judge a population from a sample. Creating a null and alternative hypothesis, deciding on a significance level, and applying statistical tests to assess the theory are all part of the hypothesis testing process. The range of values the population parameter is expected to fall within is provided by confidence intervals.
The t-test and ANOVA are two tests for means that compare means between groups. The chi-square test, which contrasts the distribution of categorical data between groups, is one type of proportional test. Based on sample data, these tests assist researchers in making well-informed conclusions regarding the population.
Data Visualization
For complex datasets to be effectively communicated, data visualization is necessary. Visual representations allow A larger audience to comprehend the data’s patterns, trends, and relationships. Plots frequently used include:
- Scatter plots, which show how two variables are related to one another.
- Bar graphs, which are excellent for comparing categories.
- Histograms, which illustrate the distribution of numerical data.
For example, a bar graph can compare sales numbers across different product categories, while a histogram can show the distribution of consumer ages. Meanwhile, a scatter plot can help marketers optimize their strategies by showing relationships between sales income and advertising costs.
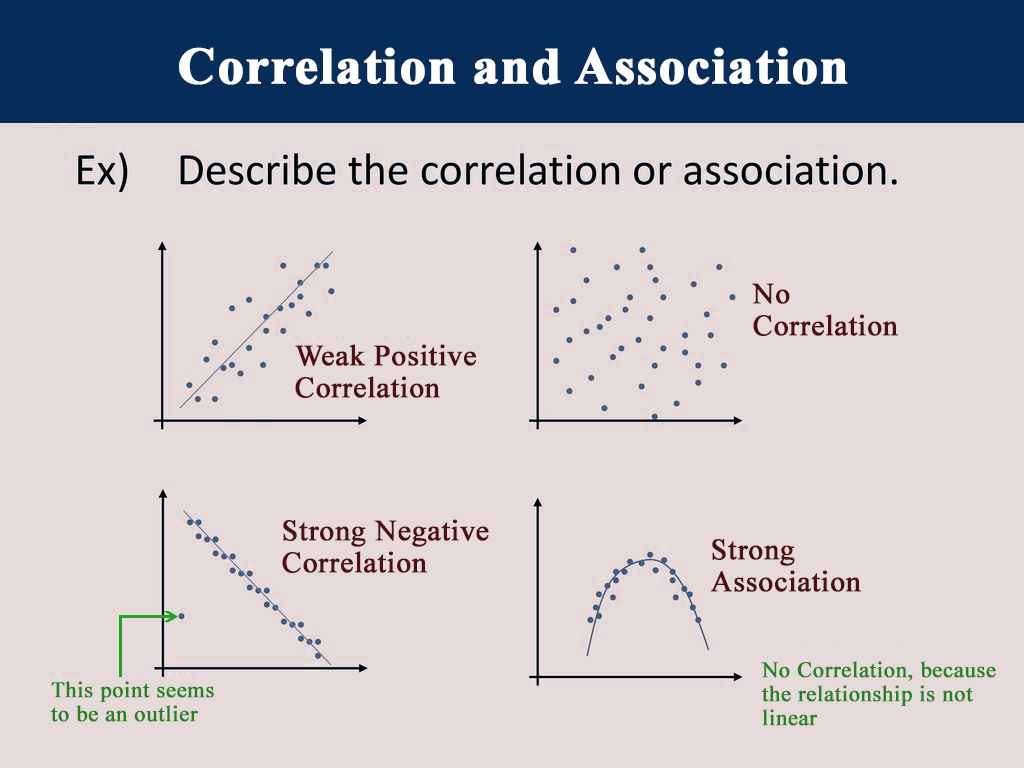 Correlation and Association
Correlation and association are methods used to quantify the relationship between two variables. A correlation of 0 denotes no association, and the correlation coefficient (r) runs from -1 (perfect negative correlation) to 1 (perfect positive correlation). A positive correlation indicates a tendency for both variables to grow as one increases. When there is a negative correlation, one variable tends to drop as the other increases.
If there is no correlation, there is no systematic relationship. While it does not necessarily imply causality, knowing correlation and association can help identify correlations between variables. Robust correlations can direct additional research into putative causal links.
Conclusion
To sum up, fundamental statistical methods, including correlation analysis, inferential statistics, and descriptive statistics, are necessary for researchers to extract valuable information from data. Using these tools, researchers can test hypotheses, visualize and summarize data, and determine correlations between variables.