This manual walks researchers through the difficult task of developing an accurate and compelling Hypothesis. Develop your scientific skills by learning the fundamentals of hypothesis development, which are vital for generating significant discoveries.
What is a Hypothesis?
A hypothesis is a precise, verifiable report or forecast that offers a theory to account for an occurrence or collection of data. Science relies on informed guesses and tentative assumptions to investigate and test. Before doing experiments or obtaining data, a hypothesis is developed in the scientific method, serving as a roadmap for the investigation.

What are the Benefits of Hypothesis Testing?
By comparing novel theories or concepts to evidence, scientific hypothesis testing assists in determining their accuracy.
- This helps prevent inaccurate claims and conclusions by enabling researchers to assess if the evidence supports their theory.
- The hypothesis testing framework offers for basing judgments on the evidence rather than conjecture or opinion, which is another advantage of the method.
- Hypothesis testing provides a solid foundation for drawing well-informed findings by minimizing the effects of chance and confounding variables through statistical analysis.
What are the Guidelines for Formulating a Hypothesis?
A testable hypothesis is a nuanced statement crucial in scientific experiments. Crafting one involves careful consideration of key elements:
- Problem Statement
Clearly articulate the problem, providing a focused perspective for the experiment.
- If-Then Structure
Frame the hypothesis as an if-then statement, outlining a causal relationship between a specific action and an expected outcome.
- Variable Definition
Differentiate between independent and dependent variables. Independents are manipulated, while changes influence dependents.
- Scrutiny
Thoroughly examine the hypothesis, ensuring coherence, relevance, and alignment with the experiment’s goals. Refine as needed for precision.
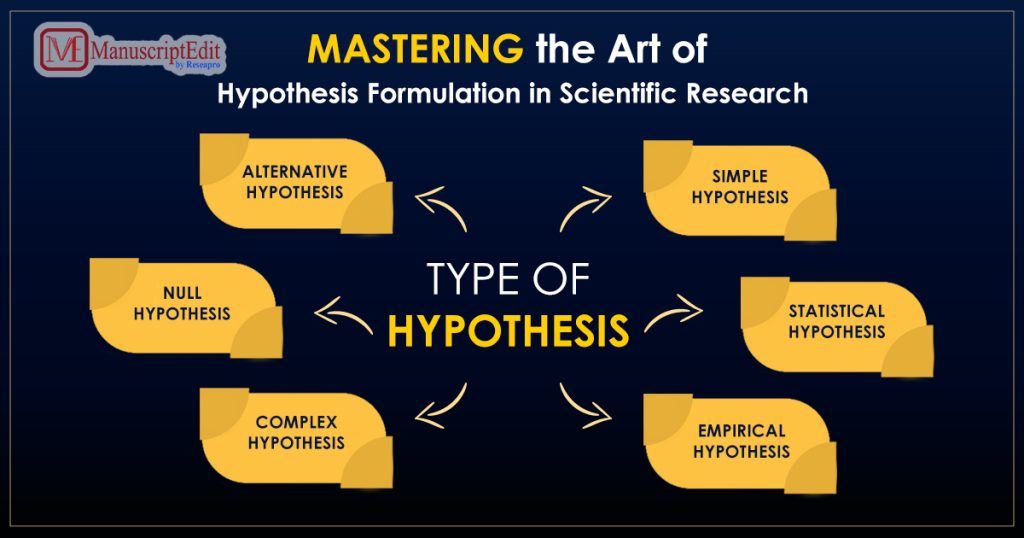
- Simple Hypothesis predicts how one dependent variable and one independent variable will relate.
- Complex Hypothesis makes predictions about the connections between several independent and dependent variables.
- The Directional Hypothesis describes the relationship’s anticipated direction as determined by theory. It shows the researcher’s dedication to a specific result.
- Non-directional Hypothesis doesn’t precisely forecast the direction of the relationship—this theory, when applied in contradiction to prior findings or without a theoretical foundation.
- Associative Hypothesis describes how variables are dependent on one another.
- The Causal Hypothesis assumes that manipulating the independent variable will impact the dependent.
- Null Hypothesis demonstrates a lousy correlation between the variables. It asserts that manipulating the independent variable has not affected the dependent variable. Results are attributed to chance and are unimportant to the investigation’s support.
- An Alternate Hypothesis demonstrates a strong correlation between the research variables. It manipulates the independent variable to predict changes in the dependent variable. Results are asserted to be not the result of chance, proving the researched theory.
How to do Statistical Hypothesis Testing?
Describe your Null and Alternate Hypothesis
Null Hypothesis (H₀) is what is assumed by default. Usually, it indicates that nothing has changed, altered, or had an impact.
Alternate Hypothesis (H₁): You’re attempting to provide evidence for this. It implies a noteworthy impact, distinction, or alteration.
Gather Information
Compile pertinent data using surveys, experiments, observations, or other appropriate techniques. Ensure your data is impartial and representative to derive valuable inferences.
Run a Statistical Analysis
Choose a statistical test (such as the ANOVA or t-test) appropriate for your research strategy and data type. This test can examine whether the observed differences are statistically significant.
Choose Whether to Reject your Null Hypothesis or not.
Comparable to a probability, the p-value allows you to determine the validity of the first or null hypotheses. When the p-value is less than 0.05, your goal often indicates a strong probability that your earlier estimate was incorrect. In this case, reject the null hypothesis.
If it is higher, you cannot leave the null hypothesis. If it is higher, you cannot reject the null hypothesis. In addition to statistical significance, consider the practical relevance of your findings.
Show your Findings
Explain your findings clearly, mentioning the statistical test performed, the p-value, and the conclusion about the null hypothesis. Talk about the study’s limitations and the practical ramifications of your findings.
Give your audience background information so they can comprehend the significance of your findings about the more extensive study issue. Incorporate graphical representations such as charts or graphs to improve the comprehension of your results.
Examples of Well-Formulated Hypotheses
- Hypothesis Testing facilitates experimenting with various pedagogical approaches to address varying student comprehension levels.
- Hypothesis Testing aids in identifying potential contributing variables to significant mental health problems.
Conclusion
A statistical procedure known as hypothesis testing aids researchers and analysts in assessing a study’s dependability. A well-crafted hypothesis and a battery of statistical tests allow people or organizations to extrapolate conclusions about the population under investigation from the available data.
Testing hypotheses is essential in the scientific method since it allows for testing presumptions and improved data-driven decision-making.