
Statistics is the science of designing experiments, collecting data, analyzing data, and learning from data for the purpose of decision-making and scientific discoveries. In other words, statistics is the science of learning from data. Statistics analysis methods include various tools and analytical techniques in order to deal with the massive extent of data for making inferences about the population, from the, picked out sample data that can be used by researchers to solve their problems.

4 Fundamentals of Statistical Analysis
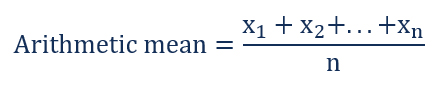
- Mean
The arithmetic mean is commonly known as the ‘Average’. Arithmetic mean is the total of the sum of all values in a collection of numbers divided by the number of numbers in a collection. The mean value is denoted by ‘µ’. It is calculated in the following way:
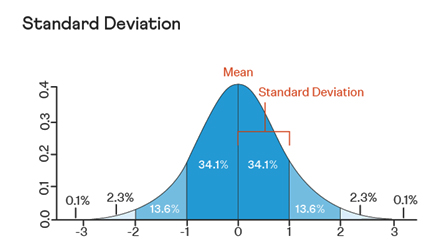
- Standard Deviation
Standard deviation is the degree of dispersion or the scatter of the data points relative to its mean, in descriptive statistics. It tells how the values are spread across the data sample and it is the measure of the variation of the data points from the mean. The standard deviation of a sample, statistical population, random variable, data set, or probability distribution is the square root of its variance.
The formula to calculate standard deviation:

where,
σ = population standard deviation
N = the size of the population
xi = each value from the population
µ = the population mean
- Regression
Regression analysis is a set of statistical methods used for the estimation of relationships between a dependent variable and one or more independent variables. It can be utilized to assess the strength of the relationship between variables and for modeling the future relationship between them. Regression analysis includes several variations, such as linear, multiple linear, and nonlinear. Linear regression analysis is based on six fundamental assumptions: (1) The dependent and independent variables show a linear relationship between the slope and the intercept, (2) The independent variable is not random, (3) The value of the residual (error) is zero, (4) The value of the residual (error) is constant across all observations, (5) The value of the residual (error) is not correlated across all observations, and (6) The residual (error) values follow the normal distribution.
The formula to calculate regression:
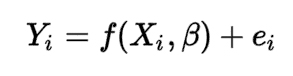
where,
Yi = dependent variable
f = function
Xi = independent variable
β = unknown parameters
ei = error terms
- Hypothesis Testing
Hypothesis testing is used to assess the plausibility of a hypothesis by using sample data.
The test provides evidence concerning the plausibility of the hypothesis, given the data.
Statistical analysts test a hypothesis by measuring and examining a random sample of the population being analyzed. Steps of Hypothesis Testing: (a) The first step is for the analyst to state the two hypotheses so that only one can be right, (b) The next step is to formulate an analysis plan, which outlines how the data will be evaluated, (c) the third step is to carry out the plan and physically analyze the sample data, and (d) the fourth and final step is to analyze the results and either reject the null hypothesis, or state that the null hypothesis is plausible, given the data.
Conclusion
Statistical methods are mathematical formulas, models, and techniques that are used in the statistical analysis of raw research data. The application of statistical methods extracts information from research data and provides different ways to assess the robustness of research outputs.